Surface of the Parabola, hyperbola, ellipse function
Surface of the Parabola, hyperbola, ellipse function:-
In this section, we discuss how to plot the surface of the Revolution of the curve for Parabola, Hyperbola and Ellipse function in Python Programming.
The implementation of the code is done using Matplotlib one of the most popular library is used for plotting the graph of the equation. we used Contourf() function for Plotting the Surface of the Revolution of the curve for Parabola, Hyperbola, and Ellipse function.
If you don't know about the contourf() function then you must read Contour Plots first then continue with this. You may also check Python Libraries link if you want to know how to install and use the Matplotlib library in Python.
Now we check how to draw these functions one by one. First of all, learn about the Surface of the Revolution of the curve for Parabola function then Hyperbola and Ellipse function with code and output.
plt.contour() - for contour plots
plt.contourf() - for filled contour plots
There are three types of conic sections:
parabolas, hyperbolas, and ellipses. Circles are a specific case of ellipses. Geometrically, conic sections are defined
by intersecting a cone with a plane.
When a Conic section can fit between three vertices in the polyline approximation to a contour. The places where conic sections are joined are called knots.
Conic splines are a sequence of conic sections that are joined end to end, with equal tangents at the knots to provide an easy transition between adjoining sections of the curve.
plt.contourf() - function is used to create filled contour plots. Three arguments: a grid of x values, a grid of y values, and a grid of z values used here. The x and y values represent positions on the plot, and the z values will be represented through the contour levels. the most simple way to prepare such information is to use the np.meshgrid function, which builds two-dimensional grids from one-dimensional arrays.
Surface of Parabola:-
Python Code:
import numpy as np
from matplotlib import pyplot as plt
x = np.linspace(-3,3)
y = np.linspace(-3,3)
x,y = np.meshgrid(x,y)
z = y**2 + 4*x
plt.figure()
levels = [-2,-1,0,1]
plt.contourf(x,y,z,levels)
plt.xlabel('x values')
plt.ylabel('y values')
plt.title('Surface of Parabola')
plt.grid(True)
plt.show()
Output: Surface of Parabola

Surface of Parabola
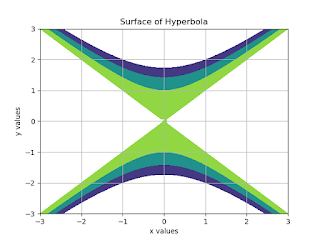
Surface of Hyperbola:-
Output: Surface of Parabola
 |
| Surface of Parabola |
Python Code:
import numpy as np
from matplotlib import pyplot as plt
x = np.linspace(-3,3)
y = np.linspace(-3,3)
x,y = np.meshgrid(x,y)
z = 1+x**2-y**2plt.figure()
levels = [-2,-1,0,1]
plt.contourf(x,y,z,levels)
plt.xlabel('x values')
plt.ylabel('y values')
plt.title('Surface of Hyperbola')
plt.grid(True)
plt.show()
Output: Surface of Hyperbola


             Surface of Hyperbola
Python Code:
import numpy as np from matplotlib import pyplot as plt x = np.linspace(-3,3) y = np.linspace(-3,3) x,y = np.meshgrid(x,y) z = 1+x**2-y**2plt.figure() levels = [-2,-1,0,1] plt.contourf(x,y,z,levels) plt.xlabel('x values') plt.ylabel('y values') plt.title('Surface of Hyperbola') plt.grid(True) plt.show()Output: Surface of Hyperbola
Surface of Hyperbola
Surface of Ellipse:-
Python Code:
import numpy as np
from matplotlib import pyplot as plt
x = np.linspace(-3,3)
y = np.linspace(-3,3)
x,y = np.meshgrid(x,y)
z = 1- x**2-y**2
plt.figure()
levels = [-2,-1,0,1]
plt.contourf(x,y,z,levels)
plt.xlabel('x values')
plt.ylabel('y values')
plt.title('Surface of Ellipse')
plt.grid(True)
plt.show()
Output: Surface of Ellipse

Surface of Ellipse
Summary: In this section, we discuss the code for the Plotting the Surface of the Revolution of the curve for of the parabola, hyperbola and ellipse for filled contour plots with output. In this code first, we need to import numpy (stands for Numerical Python) and we used numpy as np then we need to import matplotlib which is necessary to plot a graph. so we defined matplotlib as plt. In this matplotlib.pyplot is a collection of functions that make matplotlib work like MATLAB. For every pyplot function makes some change to a figure: e.g., creates a figure, creates a plotting area in a figure, plots some lines in a plotting area, decorates the plot with x and y labels, the title of the graph, grid to show grid in the graph etc.
Surface of Ellipse:-
Python Code:
import numpy as np
from matplotlib import pyplot as plt
x = np.linspace(-3,3)
y = np.linspace(-3,3)
x,y = np.meshgrid(x,y)
z = 1- x**2-y**2
plt.figure()
levels = [-2,-1,0,1]
plt.contourf(x,y,z,levels)
plt.xlabel('x values')
plt.ylabel('y values')
plt.title('Surface of Ellipse')
plt.grid(True)
plt.show()
from matplotlib import pyplot as plt
x = np.linspace(-3,3)
y = np.linspace(-3,3)
x,y = np.meshgrid(x,y)
z = 1- x**2-y**2
plt.figure()
levels = [-2,-1,0,1]
plt.contourf(x,y,z,levels)
plt.xlabel('x values')
plt.ylabel('y values')
plt.title('Surface of Ellipse')
plt.grid(True)
plt.show()
Output: Surface of Ellipse
 |
Surface of Ellipse
|
Summary: In this section, we discuss the code for the Plotting the Surface of the Revolution of the curve for of the parabola, hyperbola and ellipse for filled contour plots with output. In this code first, we need to import numpy (stands for Numerical Python) and we used numpy as np then we need to import matplotlib which is necessary to plot a graph. so we defined matplotlib as plt. In this matplotlib.pyplot is a collection of functions that make matplotlib work like MATLAB. For every pyplot function makes some change to a figure: e.g., creates a figure, creates a plotting area in a figure, plots some lines in a plotting area, decorates the plot with x and y labels, the title of the graph, grid to show grid in the graph etc.


