Greatest Integer Function
Greatest Integer Function:
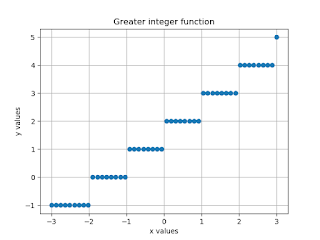
Plotting the graph of the greatest integer function and discuss the effect of a and b on the graph.
In this section, We discussed how to Plot the greatest integer function in Python Programming. It returns greater, less than or equal to a real number. In other words, we can say that the greatest integer function 'Rounds down' any number to recover the nearest integer.We can define the floor function for the greatest integer function. So, in this case, we find out the greatest integer for a given value and plotting graph for that value using Numpy and Matplotlib library.
We know that The Greatest Integer Function is also known as the Floor Function. It is written as f(x)=⌊x⌋.
Here ⌊x⌋ - is the largest integer value that is less than or equal to x.
Some examples for the greatest integer function:
[1] = 1 [1.5] = 1 [3.7] = 3 [4.3] = 4
Let's take a look at how to find out the greatest integer function in Python. First of all, We discuss how to print the value using the floor function then we move to plot the graph of the greatest integer function using the floor function.
Let's start discuss these fucntion using Python Code.1) Find the value for the greatest integer function using floor method: 0.23Python Code:import numpy as np from matplotlib import pyplot as plt f = 0.23y = np.floor(f) print(y) Output: 0.02) Find the value for the greatest integer function using floor method: 1.7Python Code:import numpy as np from matplotlib import pyplot as plt f = 1.7y = np.floor(f) print(y) Output: 1.03) Find the value for the greatest integer function using floor method: -0.54Python Code:import numpy as np from matplotlib import pyplot as plt f = -0.54y = np.floor(f) print(y) Output: -1.04) Find the value for the greatest integer function using floor method: -2.34Python Code:import numpy as np from matplotlib import pyplot as plt f = -2.34y = np.floor(f) print(y) Output: -3.05) Find the value for the greatest integer function using floor method: 2Python Code:import numpy as np from matplotlib import pyplot as plt f = 2y = np.floor(f) print(y) Output: 2.0Plotting the graph of the greatest integer function:-
Python Code:import numpy as np from matplotlib import pyplot as plt x = np.linspace(-3,3) a = 1b = 2f = a*x+b y = np.floor(f) plt.plot(x,y,'o') plt.xlabel('x values') plt.ylabel('y values') plt.grid(True) plt.title('Greater integer function') plt.show()Output:
Greatest Integer Function Summary: In this, we discussed the Greatest Integer Function and their effect on a and b on the graph. The greatest integer function used floor method to find out the value and to plot the graph of the equation. So in this case use of Numpy and Matplotlib library for the plotting the function.The reason behind the use of plt here because of the declaration of matplotlib as plt. In this case from matplotlib import pypot for plotting the graph. For every pyplot function makes some change to a figure: e.g., plots some lines in a plotting area, decorates the plot with x (no of elements), y labels (no. of values) and the title of the graph, plt.grid to show grid in the graph, plt.show() is used to show the graph, etc.This graph is showing to plotting the greatest integer function by using floor function in Python Programming with code and output. To make it more clear used some examples of the greatest integer function with the definition. In this we also defined how to find out the value of the greatest integer function by using the floor function.If you have any query about the libraries how to install and import then check this article Python libraries to read in detail.


.png)