To Plot Exponential Decay Model in Python using Odeint
To Plot Exponential Decay Model in Python using Odeint
In this, we discuss Exponential Decay Model in Python using Odeint and also discuss how to plot Exponential Decay Model in Python Programming using library Matplotlib.
You can also check this post Exponential Decay Model in Python using Odeint
If you are new to Python Programming also check the list of topics given below.
Let's take a look at how to Plot Exponential Decay model in Python Programming.
Example 1:
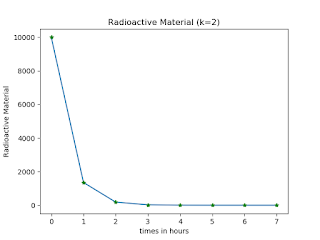
A sample of radioactive material contains 1000 atoms at start of sample follow on exponential decay constant k =2. Draw the graph. How many atoms will the sample contain after 3 hours?
Python Code:
import numpy as np
from matplotlib import pyplot as plt
from scipy.integrate import odeint
k = 2
def f(y, x):
    return -k * y
xs = np.arange(0,8,1)
y0 = 10000
ys = odeint(f, y0, xs)
for i in xs:
    if i==3:
        k = int(i)
        print('the number of atoms after' + str(i) + 'hours is' + str (ys[k]))
plt.plot(xs,ys)
plt.plot(xs,ys,'g*')
plt.xlabel('times in hours')
plt.ylabel('Radioactive Material')
plt.title('Radioactive Material (k=2)')
plt.show()Output:the number of atoms after3hours is[24.78751775]
 |
| To Plot Exponential Decay Model in Python |
Example 2:
A sample of radioactive material contains 1000 atoms at start of sample follow on exponential decay constant k =2. Draw the graph for different values of rate constant?
Python Code:import numpy as np
from matplotlib import pyplot as plt
from scipy.integrate import odeint
k1 = 0.1
k2 = 0.3
k3 = 0.4
def f1(y, x):
return -k1 * y
def f2(y, x):
return -k2 * y
def f3(y, x):
return -k3 * y
xs = np.arange(0,10,1)
y0 = 100
y1 = odeint(f1, y0, xs)
y2 = odeint(f2,y0,xs)
y3 = odeint(f3,y0,xs)
plt.plot(xs,y1)
plt.plot(xs,y1,'g*--')
plt.plot(xs,y2)
plt.plot(xs,y2,'b*--')
plt.plot(xs,y3)
plt.plot(xs,y3,'r*--')
plt.xlabel('times in hours')
plt.ylabel('Radioactive Material')
plt.title('Radioactive Material (k=0.1,0.3,0.4)')
plt.show()Output:
To Plot Exponential Decay Model in Python


