Plotting using contour in Python
Plotting using contour in Python
using contour():- In this section, we discuss plotting using contour function which is used to create contour plots. First of all, moving on to this tutorial you should first read what is Contour plots. We will discuss here some equations which can be implemented in Python using contour(). so in this section, we will discuss how to plot a function of a given equation using contour. we will discuss these functions one by one with code in Python and with output.Examples using Contour in Python
1. To plot function f(x,y) = 10-x2-y2 when value of z = [1,6,9]
Python Code:
import numpy as np
import matplotlib.pyplot as plt
x = np.linspace(-10, 10, 21)
y = np.linspace(-10, 10, 21)
x,y=np.meshgrid(x,y)
z=10-x**2-y**2levels=np.array([1,6,9])
cs=plt.contour(x,y,z,levels)
plt.clabel(cs,inline=1,fontsize=9)
plt.grid(True)
plt.axis('scaled')
plt.xlabel('x-axis')
plt.ylabel('y-axis')
plt.title('Level curves of the function f(x,y) =10-x**2-y**2')
plt.show()
Output:
![To plot function f(x,y) = 10-x2-y2 when value of z = [1,6,9] To plot function f(x,y) = 10-x2-y2 when value of z = [1,6,9]](https://blogger.googleusercontent.com/img/b/R29vZ2xl/AVvXsEhDbN-uu_AlSTlQqTCX6Y7R0ghV6_OG8_LwuKpUsP3Txq81eGHmxv6xdDUouLpfHhixyppCbpKOq3bJb87eiDHdD3hKDZAO8zUsy_46je9gT0bEFaetcTW_prHubuGmShDYLJwpO_TIww8/s400/To+plot+function+f%2528x%252Cy%2529+%253D+10-x2-y2+when+value+of+z+%253D+%255B1%252C6%252C9%255D.png) |
| To plot function f(x,y) = 10-x2-y2 when value of z = [1,6,9] |
2. To plot function f(x,y) = x2 + y2 when value of z = [1,6,9]
Python Code:
import matplotlib.pyplot as plt
import numpy as np
x = np.linspace(-10, 10, 21)
y = np.linspace(-10, 10, 21)
x, y = np.meshgrid(x, y)
z = x ** 2 + y ** 2levels = np.array([1, 6, 9])
cs = plt.contour(x, y, z, levels)
plt.clabel(cs, inline=1, fontsize=9)
plt.grid(True)
plt.axis('scaled')
plt.xlabel('x-axis')
plt.ylabel('y-axis')
plt.title('Level curves of the function f(x,y) =x**2+y**2.')
plt.show()
Output:
 |
Level curves of the function f(x,y) =x**2+y**2
|
3. To plot function f(x,y) = x3-y when value of z = [1,6]
Python Code:
import matplotlib.pyplot as plt
import numpy as np
x = np.linspace(-10, 10, 21)
y = np.linspace(-10, 10, 21)
x, y = np.meshgrid(x, y)
z = x ** 3 - y
levels = np.array([1, 6])
cs = plt.contour(x, y, z, levels)
plt.clabel(cs, inline=1, fontsize=9)
plt.grid(True)
plt.axis('scaled')
plt.xlabel('x-axis')
plt.ylabel('y-axis')
plt.title('Level curves of the function f(x,y) =x**3-y')
plt.show()
Output:
4. To plot function f(x,y) = (x2 + y2 ) /4 when value of z = [1,5,8]
Python Code:
![To plot function f(x,y) = x3-y when value of z = [1,6] To plot function f(x,y) = x3-y when value of z = [1,6]](https://blogger.googleusercontent.com/img/b/R29vZ2xl/AVvXsEhT2BSTqIaPpZGjz8VQpHWQrYhrLFC_FIkBeijDrqAmKv-7DryhqLsAgIs4OJhrIkJj_wypNTCJRduLLWzLceyujsBfaT_q7OSzmq-L6qenjoXFbjuHJFR361RkUiKbuiZ_h9aGQeN5BJw/s400/Level+curves+of+the+function+f%2528x%252Cy%2529+%253Dx3-y.png) |
To plot function f(x,y) = x3-y when value of z = [1,6]
|
4. To plot function f(x,y) = (x2 + y2 ) /4 when value of z = [1,5,8]
Python Code:
import matplotlib.pyplot as plt
import numpy as np
x = np.linspace(-10, 10, 21)
y = np.linspace(-10, 10, 21)
x,y=np.meshgrid(x,y)
z=x**2+y**2/4levels=np.array([1,5,8])
cs=plt.contour(x,y,z,levels)
plt.clabel(cs,inline=1,fontsize=9)
plt.grid(True)
plt.axis('scaled')
plt.xlabel('x-axis')
plt.ylabel('y-axis')
plt.title('Level curves of the function f(x,y) =x**2+y**2/4')
plt.show()
Output:
![To plot function f(x,y) = (x2 + y2 )/ 4 when value of z = [1,5,8] To plot function f(x,y) = (x2 + y2 )/ 4 when value of z = [1,5,8]](https://blogger.googleusercontent.com/img/b/R29vZ2xl/AVvXsEg4dURuFk-rqDPs8Lwc24zPyEFz59Ifng6-t55-aAzQUMlO3bKbAhhTlmkdjUc9HUYqY1OHnAXO_6HTSpMNWia4_mv7eC8iGDdxRiLcp7swHmO5YMBgfhkICjNOOjSsPfNULxNKSD1viB8/s400/To+plot+function+f%2528x%252Cy%2529+%253D+%2528x2+%252B+y2+%2529+4+when+value+of+z+%253D+%255B1%252C5%252C8%255D.png) |
| To plot function f(x,y) = (x2 + y2 ) /4 when value of z = [1,5,8] |
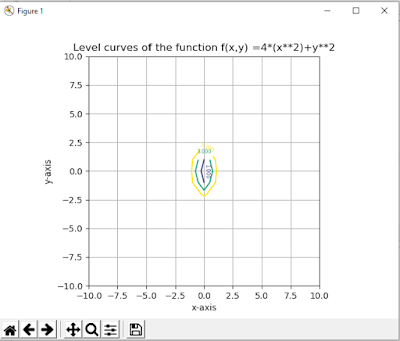
5. To plot function f(x,y) = 4x2+y2 when value of z = [0,1,3,5]
Python Code:
import matplotlib.pyplot as plt
import numpy as np
x = np.linspace(-10, 10, 21)
y = np.linspace(-10, 10, 21)
x,y=np.meshgrid(x,y)
z=4*(x**2)+y**2levels=np.array([0,1,3,5])
cs=plt.contour(x,y,z,levels)
plt.clabel(cs,inline=20,fontsize=6)
plt.grid(True)
plt.axis('scaled')
plt.xlabel('x-axis')
plt.ylabel('y-axis')
plt.title('Level curves of the function f(x,y) =4*(x**2)+y**2')
plt.show()
Output:
 |
To plot function f(x,y) = 4x2+y2 when value of z = [0,1,3,5]
|
6. To plot function f(x,y) = 2-x-y when value of z = [-6,-4,-2,0,2,4,6]
Python Code:
import matplotlib.pyplot as plt
import numpy as np
x = np.linspace(-10, 10, 21)
y = np.linspace(-10, 10, 21)
x,y=np.meshgrid(x,y)
z=2-x-y
levels=np.array([-6,-4,-2,0,2,4,6])
cs=plt.contour(x,y,z,levels)
plt.clabel(cs,inline=1,fontsize=9)
plt.grid(True)
plt.axis('scaled')
plt.xlabel('x-axis')
plt.ylabel('y-axis')
plt.title('Level curves of the function f(x,y) =2-x-y')
plt.show()
Output:
![To plot function f(x,y) = 2-x-y when value of z = [-6,-4,-2,0,2,4,6] To plot function f(x,y) = 2-x-y when value of z = [-6,-4,-2,0,2,4,6]](https://blogger.googleusercontent.com/img/b/R29vZ2xl/AVvXsEgq43Yono405BxFGCYn-xtoXZiA6WbddvFPn9EG2MFKpBvBdqGPQ_GWctoZlFVxU2juRQ8wAl0Bn2Gnu_UH1Idt4ZF0TlQkQyH5qcKGT7gAQy2woYiitO8Hbe4uAzyWf6ilvTzVZjd5DcM/s320/To+plot+function+f%2528x%252Cy%2529+%253D+2-x-y+when+value+of+z+%253D+%255B-6%252C-4%252C-2%252C0%252C2%252C4%252C6%255D.png) |
| To plot function f(x,y) = 2-x-y when value of z = [-6,-4,-2,0,2,4,6] |
Summary: In this section, we discuss the code for the. In this code first, we need to import numpy and we used numpy as np then we need to import matplotlib which is necessary to plot a graph. so we defined matplotlib as plt. In this matplotlib.pyplot is a collection of functions that make matplotlib work like MATLAB. For every pyplot function makes some change to a figure: e.g., creates a figure, creates a plotting area in a figure, plots some lines in a plotting area, decorates the plot with x and y labels and also clabel to label the curve of the fucntion, the title of the graph, grid to show grid in the graph etc.


.png)