Ordinary differential equations Growth model in Python
Ordinary differential equations Growth model in Python
In Ordinary differential equations
The General idea is that, instead of solving problems to find unknown numbers, we can solve problems to find unknown functions. There are many possibilities for this to mean, but one thing is that we have an unknown function y of x, gives that y and its derivative y'
y '= ky
where k is constant. Such a relationship between an unknown function and its derivative (or other derivative) is what is called a differential equation.
Growth Model
An example of a differential equation: Bacterial growth
Experiment 1: At the start of an experiment there are 100 bacteria. If bacteria follows an experimental growth pattern with rate k =0.02, then to find the population after 5 hours and 10 hours
import numpy as np
from scipy.integrate import odeint
k = 0.02
def f(y,x):
    return k*y
xs = np.arange(0,11,1)
y0 = 100
ys = odeint(f,y0,xs)
print(xs)
print(ys)
for i in xs:
    if i==5 or i==10:
        k = int(i)
        print('The population after' + str(i)+ 'hours is:' + str (ys[k]))
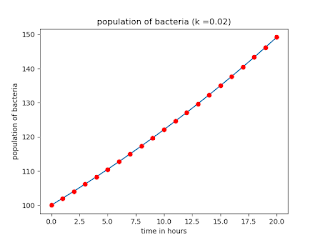
Experiment 2: At the start of an experimental there are 100 bacteria. If the bacteria follows an exponential growth pattern with rate k = 0.01, draw the graph for population v/s time for next 20 hours
import numpy as np
from scipy.integrate import odeint
from matplotlib import pyplot as plt
k = 0.02
def f(y, x):
    return k * y
xs = np.arange(0, 21, 1)
y0 = 100
ys = odeint(f, y0, xs)
for i in xs:
    if i==20:
        k = int(i)
        print('The population after' + str(i) + 'hours is:' + str(ys[k]))
plt.plot(xs,ys)
plt.plot(xs,ys,'ro')
plt.xlabel('time in hours')
plt.ylabel('population of bacteria')
plt.title('population of bacteria (k =0.02)')
plt.show()Output:The population after 20 hours is:[149.18246908] |
Ordinary differential equations Growth model in Python


