Plot Exponential growth differential equation in Python
Plot Exponential growth differential equation in Python
In this, we discuss how to Plot Exponential growth differential equation in Python Programming using Matplotlib plotting.
You can also check this post Ordinary differential equations Growth model in Python
If you are new to Python Programming also check the list of topics given below. So that you can easily understand how to Plot Exponential growth differential equation in Python.
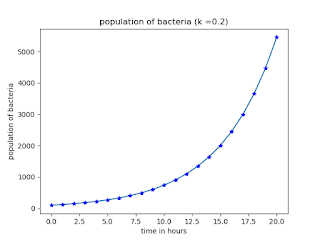
Experiment 1: There are 1000 bacteria at the start of an experiment follows an exponential growth pattern with rate k =0.2. What will be the population after 5 hours, 10 hours? Draw the Graph.
Python Code:
import numpy as np
from scipy.integrate import odeint
from matplotlib import pyplot as plt
k = 0.2
def f(y, x):
    return k * y
xs = np.arange(0, 21, 1)
y0 = 100
ys = odeint(f, y0, xs)
for i in xs:
    if i==5 or i ==10:
        k = int(i)
        print('The population after' + str(i) + 'hours is:' + str(ys[k]))
plt.plot(xs,ys)
plt.plot(xs,ys,'b*')
plt.xlabel('time in hours')
plt.ylabel('population of bacteria')
plt.title('population of bacteria (k =0.2)')
plt.show()
Output:The population after5hours is:[271.82818673]
The population after10hours is:[738.90562693]
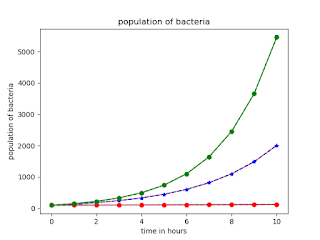
Experiment 2: There are 1000 bacteria at the start of an experiment follows an exponential growth pattern. Draw the Graph for different values with constant rate.
Python Code:import numpy as np
from scipy.integrate import odeint
from matplotlib import pyplot as plt
k1 = 0.02
k2 = 0.3
k3 = 0.4
def f1(y, x):
return k1 * y
def f2(y,x):
return k2 * y
def f3(y,x):
return k3 * y
xs = np.arange(0, 11, 1)
y0 = 100
y1 = odeint(f1, y0, xs)
y2 = odeint(f2,y0,xs)
y3 = odeint(f3,y0,xs)
plt.plot(xs,y1)
plt.plot(xs,y1,'ro--')
plt.plot(xs,y2)
plt.plot(xs,y2,'b*--')
plt.plot(xs,y3)
plt.plot(xs,y3,'go--')
plt.xlabel('time in hours')
plt.ylabel('population of bacteria')
plt.title('population of bacteria')
plt.show()


